Paul Schmelzing Is Coming to Berkeley to Talk About Interest Rates since 1310!
2024-02-12 Mo 14:00 PST: Evans Hall 639. What fascinates me: the puzzles of the relationship of financial-market patterns to what is going on in the real economy as we shifted from agrarian to imperial-commercial to industrial-revolution to and now to modern economic growth economies.
Our faster-growth economy should have a much more steeply sloped real intertemporal price system. And we today also see more opportunities that can be seized by holding the safe asset and then using it to mobilize social power quickly. So why the very large secular real safe rate decline?
Paper: <https://www.bankofengland.co.uk/working-paper/2020/eight-centuries-of-global-real-interest-rates-r-g-and-the-suprasecular-decline-1311-2018>.
Schedule link: <https://docs.google.com/spreadsheets/d/12PJ3Yty80hBTNzhjbaxMAg73r1dddbtlOgSnd1qeuUk/edit#gid=212998643>
When one starts from the perspective of financial markets and one thinks about interest and profit rates, one—or at least I—immediately want to distinguish nine different elements:
The discount for expected inflation…
The slope of the intertemporal real price system…
The premium paid by bond buyers for liquidity, colateralizability, and safety…
The discount required by bond buyers per unit of non-diversifiable risk run by holding financial assets…
The amounts of non-diversifiable risk run by holding financial assets…
The discount required by bond buyers for adverse selection in the recorded transaction prices
The rate of profit on produced means of production…
The rent rate on rural landed estates…
The rent rate on urban landholdings…
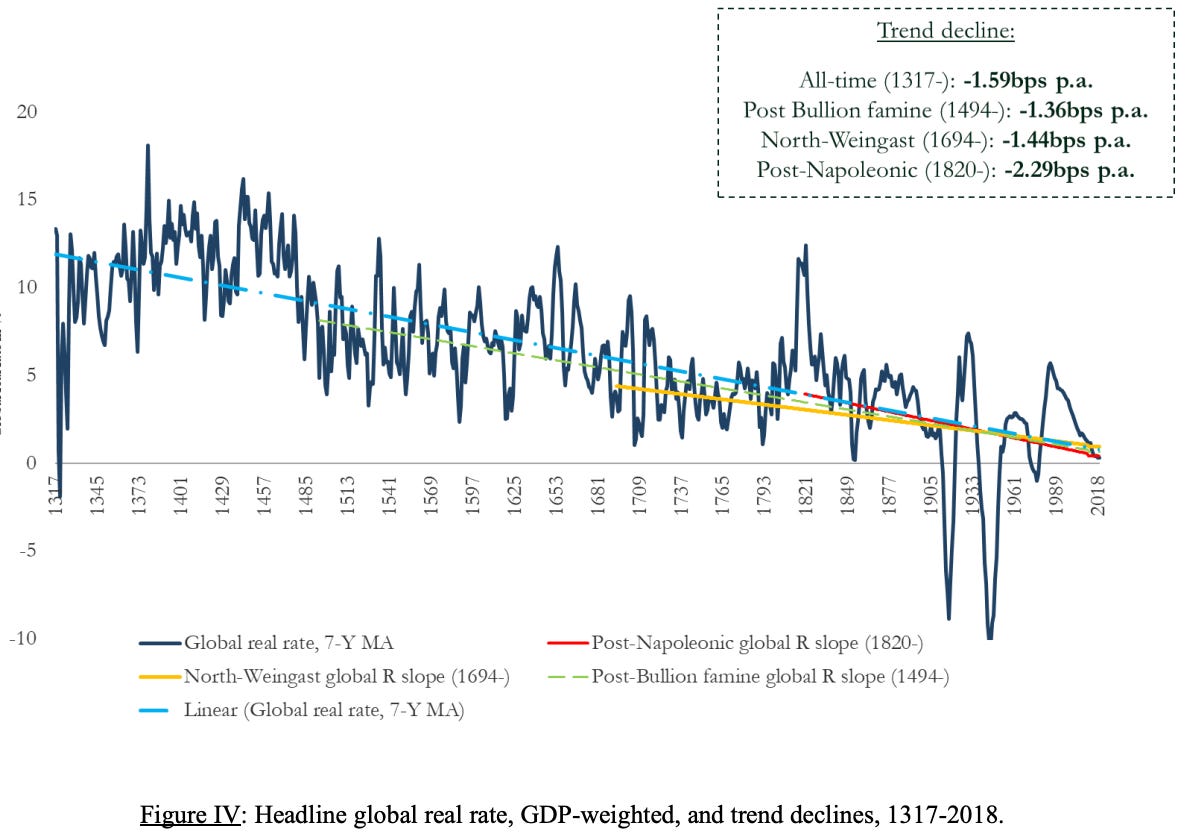
I am thinking about this because the very sharp and incredibly industrious Paul Schmelzing is coming here to Berkeley tomorrow to talk about 800 years of interest rates. The graph above is his guess at the combination of (2) and (3).
The big thing that strikes me about the graph above is that the course of human history would have led us—me, at least—to think that the safe interest rate should have risen across history. The slope of the real intertemporal price system (2) is composed of:
The rate of technological progress and income growth, times
The curvature—the extent to which the marginal utility of wealth diminished—of the utility function, plus
Whatever myopia exists that leads people to underestimate the importance of the future, plus
Whatever discounting occurs because even though the asset is safe, your ability to utilize resources and indeed your life is not.
As the world goes from a pre-1500 agrarian-age growth rate of 0.05%/year to a 1500-1770 imperial-commercial age growth rate of 0.15%/year to an industrial-revolution 1770-1870 growth rate of 0.45%/year to a post-1870 modern economic growth age growth rate of 2%/year, the slope of the intertemporal price system should have shifted from no slope to substantial slope.
Could the effect of that acquisition by the intertemporal price system of a large slope possibly be offset so overwhelmingly and leave no trace in the “safe” interest rate by diminished myopia and greater human and institutional life expectancy? Or, alternatively, could we possibly tell the story of a great increase in the liquidity, collateralizability, and safety value of holding the safe asset in a much more complex world with many more opportunities (and risks) in which the value of the ability to immediately command social power rises? Perhaps, but I really do not see a way to tell that story.
Is it that the thing that drives the safe rate is not the slope of the intertemporal price system for people in general, but rather the slope of the intertemporal price system for people with money?
And the decline in the safe interest real rate from Italian-Renaissance to Spanish-Imperial to Dutch-Commercial to British-Industrial to, finally, American financial-economic predominance is quite striking. And I do not really see what, in our world of accelerating technological progress over the past 800 years, could be driving it.
Nevertheless, I am not tempted to try to extend into the future the 800-year trend of an 0.6 bps decline in the real safe rate in an average year.
And why the increase in the real safe rate from the era of Mediterranean-feudal finance to Italian-Renaissance finance?
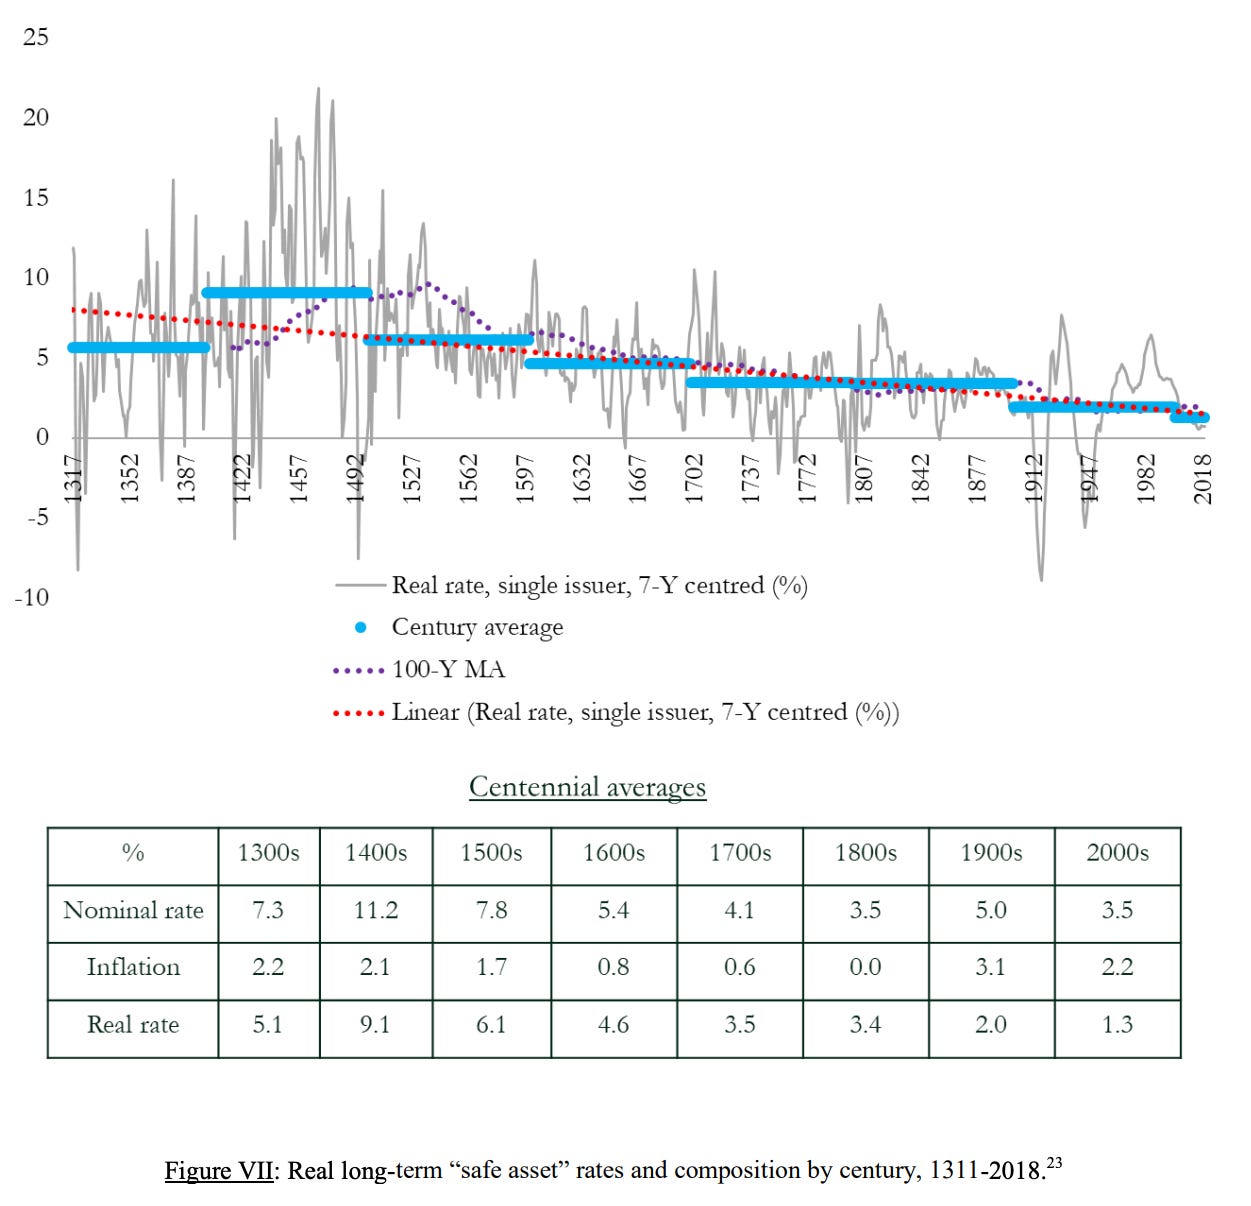
The graph below is his combination of (2) through (6):
A 1.6 bps decline in the real risky rate in an average year over the past 800 is, by contrast, not something that I find hard to credit at all.
But what I do find puzzling is that I do not see the same decline in the rate of profit: land valued at twenty years’ purchase, and enterprises valued at a 5% earnings yield seems to be close to a constant of nature, at least in western-European history.
And shouldn’t the rate of profit be coupled more tightly to the rate of interest, somehow?
Paul Schmelzing: Eight Centuries of Global Real Interest Rates, R-G, and the ‘Suprasecular’ Decline, 1311–2018: ‘Global real interest rates… covering 78% of advanced economy GDP…. Real interest rates have not been ‘stable’, and that since the major monetary upheavals of the late middle ages, a trend decline between 0.6–1.6 basis points per annum has prevailed…. Currently depressed sovereign real rates are in fact converging ‘back to historical trend’—a trend that makes narratives about a ‘secular stagnation’ environment entirely misleading, and suggests that—irrespective of particular monetary and fiscal responses—real rates could soon enter permanently negative territory…
References:
Schmelzing, Paul. “Eight Centuries of Global Real Interest Rates, R-G, and the ‘Suprasecular’ Decline, 1311–2018.” Bank of England Working Paper No. 845. <https://www.bankofengland.co.uk/-/media/boe/files/working-paper/2020/eight-centuries-of-global-real-interest-rates-r-g-and-the-suprasecular-decline-1311-2018.pdf>:


