Understanding þe Current Stance of U.S. Monetary Policy
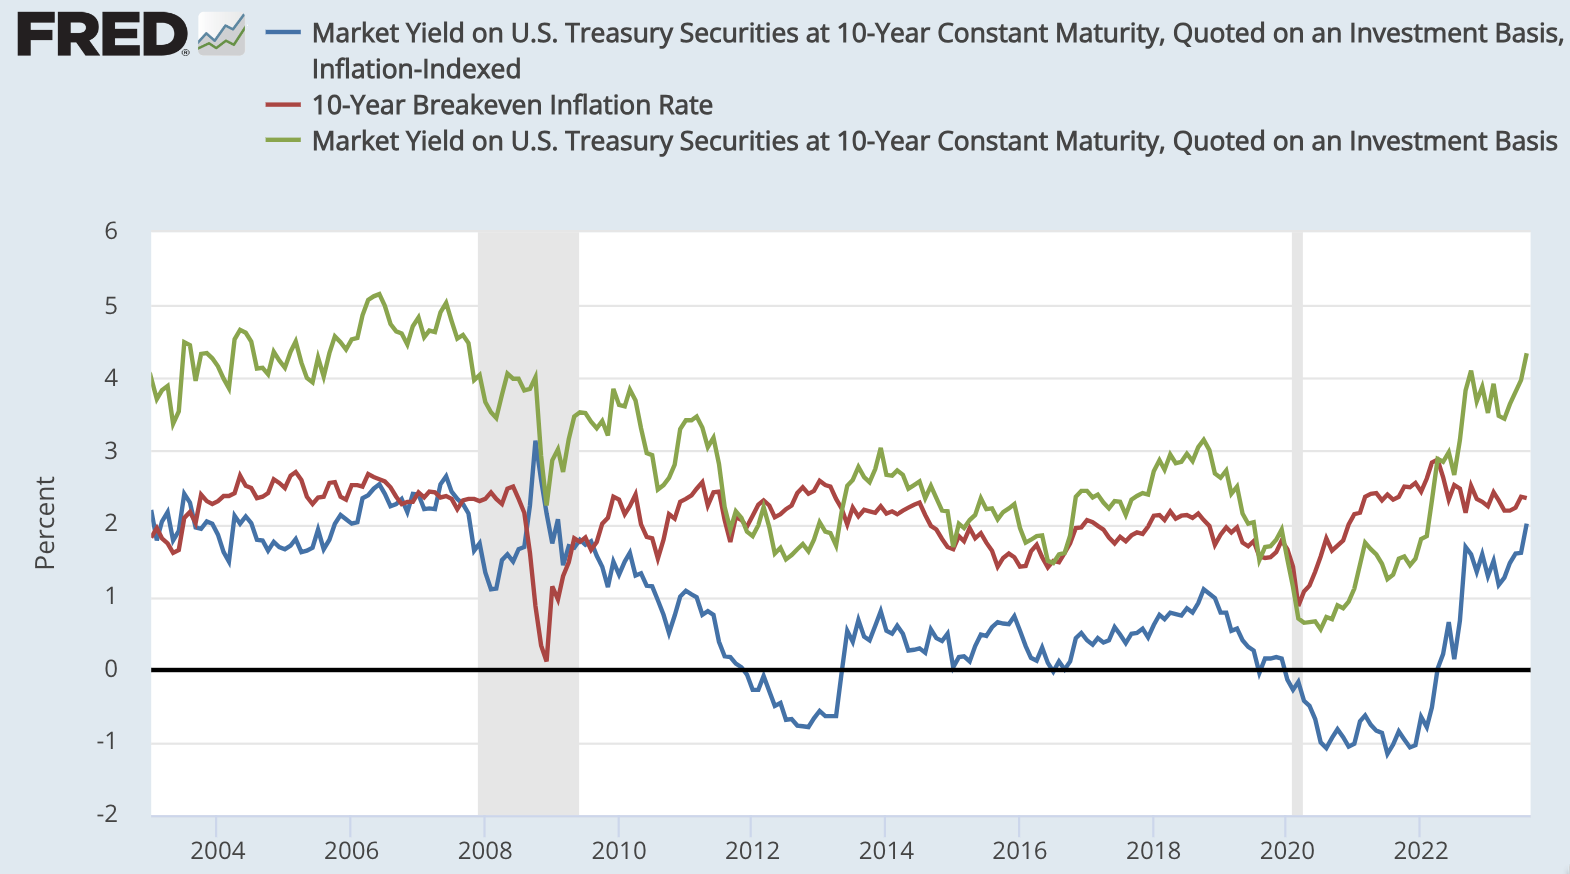
Here is the Ten-Year US Treasury bond over the past twenty years—the nominal interest rate, the real TIPS rate, and the difference between the two, which is the CPI inflation-breakeven rate:
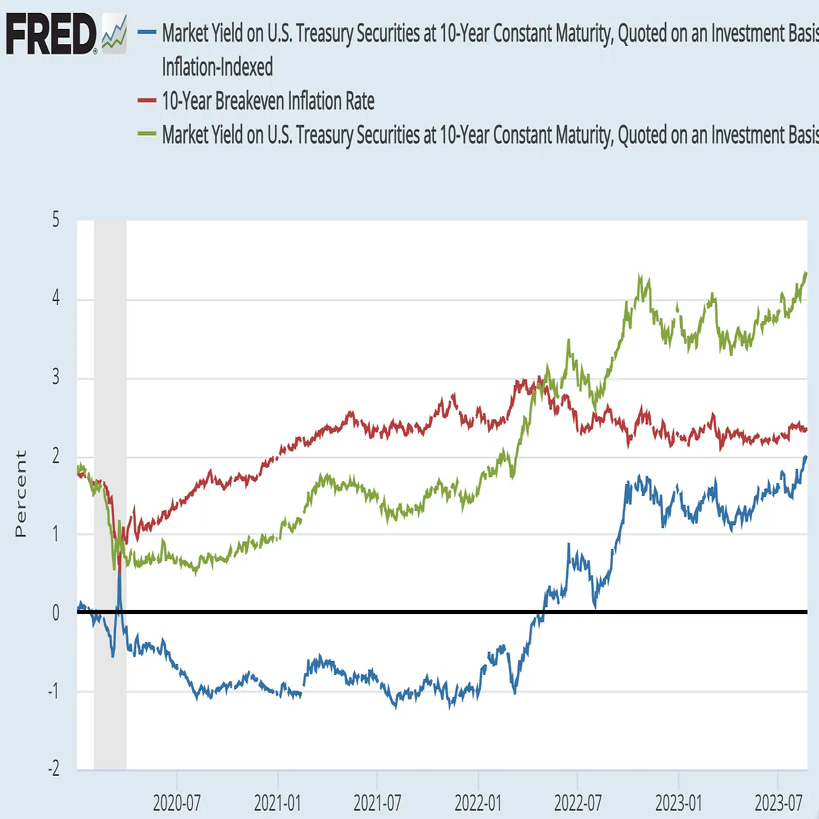
And if you want to focus on just the last three years:
The blue real-TIPS rate line is probably our best guess as to the effect of monetary policy and expected future monetary policy on the state of the macroeconomy. Financial conditions—risk appetite and credit rationing—enter into the determination of aggregate demand too, and are not in here. But focus on the blue line if you want to know how what the Federal Reserve has done, is doing, and is expected to do is goosing or dragging down spending on exports, on import-competing good, and on construction. And those three are the overwhelming bulk of the impact that monetary policy moves have on the economy.
The red inflation-breakeven rate line is probably our best guess as to the general market credibility of the Federal Reserve’s commitment to keep the Consumer Price Index CPI inflation rate at its target of roughly 2.5%/year. (You say: What? The 2%/year target is for a different measure, PCE inflation, which has in recent history been undershooting the CPI.) As you can see, the trust of the bond market at least in Federal Reserve credibility is high.
And the green nominal Ten-Year Treasury rate is the sum of the other two.
Reading the blue line as just an index of what the Fed has done, is doing, and has indicated that it will do is not right. The bond market believes that if the economy goes off the rails in one direction or another, the Federal Reserve will adjust. Thus, if the bond market concludes that Federal Reserve promises about future policy are inconsistent with keeping the economy on the rails, it will bet that Fed policy will respond to reality in a not-completely-untimely way. Think of the blue line as starting from what the Fed has done up to now, and then incorporating some combination of what the Fed has promised to do and what would actually be sustainable policy. Ten years is a short enough horizon for the Fed’s current wishes about future policy to have heavy weight in that combination. Ten years is also a long enough horizon for the market’s beliefs about long-run economic reality to have a heavyweight as all. Figure the blue line is a 50-50 combination.
With all that as prologue, what do the gyrations of the Ten-Year Treasury rate tell us?